Detect alternative TSS/CTSS
In order to detect the alternative TSS or CTSS, we directly exploit BRIE2 which is based on a Bayesian hierarchical model.
We should make preprocessing for our TSS data from CamoTSS.
prepare h5ad file
[3]:
import warnings
warnings.filterwarnings('ignore')
[4]:
import pandas as pd
import scanpy as sc
import numpy as np
Here, we can first read the count matrix which has genes with multiple TSSs from the CamoTSS_out file.
[6]:
TSSadata=sc.read('/storage/yhhuang/users/ruiyan/NPC/srafiledir/scTSS_out/all_unannotation/count/scTSS_count_two.h5ad')
TSSadata
[6]:
AnnData object with n_obs × n_vars = 51001 × 4226
    var: 'TSS_start', 'TSS_end', 'gene_id', 'Chromosome', 'Feature', 'Start', 'End', 'Strand', 'gene_name', 'len'
expadata is the expression data which can be obtained from either cellranger count or adding annotation by yourself.
[7]:
expadata=sc.read('/storage/yhhuang/users/ruiyan/NPC/srafiledir/cellranger_change_index/all_cellranger_NPC.h5ad')
expadata
[7]:
AnnData object with n_obs × n_vars = 3863735 × 33538
    obs: 'index', 'cell_id', 'batch'
    var: 'gene_ids', 'feature_types'
In order to build relationship with TSS data, we should first keep the var.index the same with the prefix of TSS id
[8]:
expadata.var['gene_name']=expadata.var.index
expadata.var.index=expadata.var['gene_ids']
expadata.var
[8]:
| gene_ids | feature_types | gene_name | |
|---|---|---|---|
| gene_ids | |||
| ENSG00000243485 | ENSG00000243485 | Gene Expression | MIR1302-2HG |
| ENSG00000237613 | ENSG00000237613 | Gene Expression | FAM138A |
| ENSG00000186092 | ENSG00000186092 | Gene Expression | OR4F5 |
| ENSG00000238009 | ENSG00000238009 | Gene Expression | AL627309.1 |
| ENSG00000239945 | ENSG00000239945 | Gene Expression | AL627309.3 |
| ... | ... | ... | ... |
| ENSG00000277856 | ENSG00000277856 | Gene Expression | AC233755.2 |
| ENSG00000275063 | ENSG00000275063 | Gene Expression | AC233755.1 |
| ENSG00000271254 | ENSG00000271254 | Gene Expression | AC240274.1 |
| ENSG00000277475 | ENSG00000277475 | Gene Expression | AC213203.1 |
| ENSG00000268674 | ENSG00000268674 | Gene Expression | FAM231C |
33538 rows × 3 columns
To make sure the cell barcode unique
[9]:
expadata.obs_names_make_unique()
expadata
[9]:
AnnData object with n_obs × n_vars = 3863735 × 33538
    obs: 'index', 'cell_id', 'batch'
    var: 'gene_ids', 'feature_types', 'gene_name'
Select the TSS with max count
[10]:
genedf=adata.var.copy()
genedf
[10]:
| TSS_start | TSS_end | gene_id | Chromosome | Feature | Start | End | Strand | gene_name | len | |
|---|---|---|---|---|---|---|---|---|---|---|
| transcript_id | ||||||||||
| ENSG00000197530_newTSS | 1629591 | 1629697 | ENSG00000197530 | 1 | gene | 1615414 | 1630610 | + | MIB2 | 15196 |
| ENSG00000197530_ENST00000518681 | 1615420 | 1615554 | ENSG00000197530 | 1 | gene | 1615414 | 1630610 | + | MIB2 | 15196 |
| ENSG00000197530_ENST00000510793 | 1616194 | 1616348 | ENSG00000197530 | 1 | gene | 1615414 | 1630610 | + | MIB2 | 15196 |
| ENSG00000189409_ENST00000435358 | 1633111 | 1633230 | ENSG00000189409 | 1 | gene | 1632162 | 1635263 | + | MMP23B | 3101 |
| ENSG00000189409_ENST00000472264 | 1632164 | 1632228 | ENSG00000189409 | 1 | gene | 1632162 | 1635263 | + | MMP23B | 3101 |
| ... | ... | ... | ... | ... | ... | ... | ... | ... | ... | ... |
| ENSG00000089820_ENST00000461052 | 153926592 | 153926836 | ENSG00000089820 | X | gene | 153907366 | 153934999 | - | ARHGAP4 | 27633 |
| ENSG00000013563_newTSS | 154411909 | 154412002 | ENSG00000013563 | X | gene | 154401235 | 154412112 | - | DNASE1L1 | 10877 |
| ENSG00000013563_ENST00000369807 | 154409083 | 154409253 | ENSG00000013563 | X | gene | 154401235 | 154412112 | - | DNASE1L1 | 10877 |
| ENSG00000183878_ENST00000479713 | 13479746 | 13479934 | ENSG00000183878 | Y | gene | 13248378 | 13480673 | - | UTY | 232295 |
| ENSG00000183878_newTSS | 13479231 | 13479358 | ENSG00000183878 | Y | gene | 13248378 | 13480673 | - | UTY | 232295 |
4226 rows × 10 columns
[11]:
genedf['count']=np.sum(adata.X,axis=0)
genedf
[11]:
| TSS_start | TSS_end | gene_id | Chromosome | Feature | Start | End | Strand | gene_name | len | count | |
|---|---|---|---|---|---|---|---|---|---|---|---|
| transcript_id | |||||||||||
| ENSG00000197530_newTSS | 1629591 | 1629697 | ENSG00000197530 | 1 | gene | 1615414 | 1630610 | + | MIB2 | 15196 | 149.0 |
| ENSG00000197530_ENST00000518681 | 1615420 | 1615554 | ENSG00000197530 | 1 | gene | 1615414 | 1630610 | + | MIB2 | 15196 | 521.0 |
| ENSG00000197530_ENST00000510793 | 1616194 | 1616348 | ENSG00000197530 | 1 | gene | 1615414 | 1630610 | + | MIB2 | 15196 | 59.0 |
| ENSG00000189409_ENST00000435358 | 1633111 | 1633230 | ENSG00000189409 | 1 | gene | 1632162 | 1635263 | + | MMP23B | 3101 | 117.0 |
| ENSG00000189409_ENST00000472264 | 1632164 | 1632228 | ENSG00000189409 | 1 | gene | 1632162 | 1635263 | + | MMP23B | 3101 | 96.0 |
| ... | ... | ... | ... | ... | ... | ... | ... | ... | ... | ... | ... |
| ENSG00000089820_ENST00000461052 | 153926592 | 153926836 | ENSG00000089820 | X | gene | 153907366 | 153934999 | - | ARHGAP4 | 27633 | 127.0 |
| ENSG00000013563_newTSS | 154411909 | 154412002 | ENSG00000013563 | X | gene | 154401235 | 154412112 | - | DNASE1L1 | 10877 | 901.0 |
| ENSG00000013563_ENST00000369807 | 154409083 | 154409253 | ENSG00000013563 | X | gene | 154401235 | 154412112 | - | DNASE1L1 | 10877 | 838.0 |
| ENSG00000183878_ENST00000479713 | 13479746 | 13479934 | ENSG00000183878 | Y | gene | 13248378 | 13480673 | - | UTY | 232295 | 3606.0 |
| ENSG00000183878_newTSS | 13479231 | 13479358 | ENSG00000183878 | Y | gene | 13248378 | 13480673 | - | UTY | 232295 | 139.0 |
4226 rows × 11 columns
[12]:
keepdf=genedf.sort_values(['gene_id','count']).groupby('gene_id').tail(2)
keepdf
[12]:
| TSS_start | TSS_end | gene_id | Chromosome | Feature | Start | End | Strand | gene_name | len | count | |
|---|---|---|---|---|---|---|---|---|---|---|---|
| transcript_id | |||||||||||
| ENSG00000000460_newTSS | 169683373 | 169683419 | ENSG00000000460 | 1 | gene | 169662006 | 169854080 | + | C1orf112 | 192074 | 418.0 |
| ENSG00000000460_ENST00000359326 | 169794958 | 169795195 | ENSG00000000460 | 1 | gene | 169662006 | 169854080 | + | C1orf112 | 192074 | 751.0 |
| ENSG00000000938_newTSS | 27626457 | 27626515 | ENSG00000000938 | 1 | gene | 27612063 | 27635185 | - | FGR | 23122 | 325.0 |
| ENSG00000000938_ENST00000457296 | 27626045 | 27626174 | ENSG00000000938 | 1 | gene | 27612063 | 27635185 | - | FGR | 23122 | 732.0 |
| ENSG00000001167_newTSS | 41080778 | 41080854 | ENSG00000001167 | 6 | gene | 41072944 | 41099976 | + | NFYA | 27032 | 103.0 |
| ... | ... | ... | ... | ... | ... | ... | ... | ... | ... | ... | ... |
| ENSG00000284691_ENST00000641717 | 150405407 | 150405450 | ENSG00000284691 | 7 | gene | 150400701 | 150412470 | + | AC073111.4 | 11769 | 100.0 |
| ENSG00000285077_ENST00000567449 | 30624493 | 30624569 | ENSG00000285077 | 15 | gene | 30624493 | 30649529 | + | AC091057.6 | 25036 | 55.0 |
| ENSG00000285077_newTSS | 30626051 | 30626146 | ENSG00000285077 | 15 | gene | 30624493 | 30649529 | + | AC091057.6 | 25036 | 421.0 |
| ENSG00000285106_newTSS | 131109754 | 131109946 | ENSG00000285106 | 7 | gene | 130791263 | 131110161 | - | AC016831.7 | 318898 | 226.0 |
| ENSG00000285106_ENST00000642963 | 131107859 | 131108049 | ENSG00000285106 | 7 | gene | 130791263 | 131110161 | - | AC016831.7 | 318898 | 6762.0 |
3568 rows × 11 columns
[13]:
firstdf=keepdf[::2]
firstdf
[13]:
| TSS_start | TSS_end | gene_id | Chromosome | Feature | Start | End | Strand | gene_name | len | count | |
|---|---|---|---|---|---|---|---|---|---|---|---|
| transcript_id | |||||||||||
| ENSG00000000460_newTSS | 169683373 | 169683419 | ENSG00000000460 | 1 | gene | 169662006 | 169854080 | + | C1orf112 | 192074 | 418.0 |
| ENSG00000000938_newTSS | 27626457 | 27626515 | ENSG00000000938 | 1 | gene | 27612063 | 27635185 | - | FGR | 23122 | 325.0 |
| ENSG00000001167_newTSS | 41080778 | 41080854 | ENSG00000001167 | 6 | gene | 41072944 | 41099976 | + | NFYA | 27032 | 103.0 |
| ENSG00000001460_newTSS | 24413671 | 24413692 | ENSG00000001460 | 1 | gene | 24356998 | 24416934 | - | STPG1 | 59936 | 57.0 |
| ENSG00000001631_newTSS | 92245433 | 92245509 | ENSG00000001631 | 7 | gene | 92198968 | 92246166 | - | KRIT1 | 47198 | 142.0 |
| ... | ... | ... | ... | ... | ... | ... | ... | ... | ... | ... | ... |
| ENSG00000278558_newTSS | 18528598 | 18528654 | ENSG00000278558 | 22 | gene | 18527801 | 18530573 | + | TMEM191B | 2772 | 97.0 |
| ENSG00000278709_newTSS | 57710609 | 57710825 | ENSG00000278709 | 20 | gene | 57710155 | 57712780 | + | NKILA | 2625 | 71.0 |
| ENSG00000284691_newTSS | 150408026 | 150408165 | ENSG00000284691 | 7 | gene | 150400701 | 150412470 | + | AC073111.4 | 11769 | 93.0 |
| ENSG00000285077_ENST00000567449 | 30624493 | 30624569 | ENSG00000285077 | 15 | gene | 30624493 | 30649529 | + | AC091057.6 | 25036 | 55.0 |
| ENSG00000285106_newTSS | 131109754 | 131109946 | ENSG00000285106 | 7 | gene | 130791263 | 131110161 | - | AC016831.7 | 318898 | 226.0 |
1784 rows × 11 columns
[14]:
seconddf=keepdf[1::2]
seconddf
[14]:
| TSS_start | TSS_end | gene_id | Chromosome | Feature | Start | End | Strand | gene_name | len | count | |
|---|---|---|---|---|---|---|---|---|---|---|---|
| transcript_id | |||||||||||
| ENSG00000000460_ENST00000359326 | 169794958 | 169795195 | ENSG00000000460 | 1 | gene | 169662006 | 169854080 | + | C1orf112 | 192074 | 751.0 |
| ENSG00000000938_ENST00000457296 | 27626045 | 27626174 | ENSG00000000938 | 1 | gene | 27612063 | 27635185 | - | FGR | 23122 | 732.0 |
| ENSG00000001167_ENST00000341376 | 41072944 | 41073076 | ENSG00000001167 | 6 | gene | 41072944 | 41099976 | + | NFYA | 27032 | 2039.0 |
| ENSG00000001460_ENST00000483261 | 24391926 | 24392095 | ENSG00000001460 | 1 | gene | 24356998 | 24416934 | - | STPG1 | 59936 | 58.0 |
| ENSG00000001631_ENST00000412043 | 92245674 | 92245834 | ENSG00000001631 | 7 | gene | 92198968 | 92246166 | - | KRIT1 | 47198 | 4188.0 |
| ... | ... | ... | ... | ... | ... | ... | ... | ... | ... | ... | ... |
| ENSG00000278558_ENST00000618859 | 18529298 | 18529492 | ENSG00000278558 | 22 | gene | 18527801 | 18530573 | + | TMEM191B | 2772 | 358.0 |
| ENSG00000278709_ENST00000614771 | 57710157 | 57710345 | ENSG00000278709 | 20 | gene | 57710155 | 57712780 | + | NKILA | 2625 | 495.0 |
| ENSG00000284691_ENST00000641717 | 150405407 | 150405450 | ENSG00000284691 | 7 | gene | 150400701 | 150412470 | + | AC073111.4 | 11769 | 100.0 |
| ENSG00000285077_newTSS | 30626051 | 30626146 | ENSG00000285077 | 15 | gene | 30624493 | 30649529 | + | AC091057.6 | 25036 | 421.0 |
| ENSG00000285106_ENST00000642963 | 131107859 | 131108049 | ENSG00000285106 | 7 | gene | 130791263 | 131110161 | - | AC016831.7 | 318898 | 6762.0 |
1784 rows × 11 columns
Get the expression data with the same cell and same genes as TSS adata
[19]:
keepexpadata=expadata[adata.obs.index.tolist(),seconddf['gene_id'].tolist()]
keepexpadata
[19]:
View of AnnData object with n_obs × n_vars = 51001 × 1784
    obs: 'index', 'cell_id', 'batch'
    var: 'gene_ids', 'feature_types', 'gene_name'
[20]:
keepexpadata.X.toarray()
[20]:
array([[0., 0., 0., ..., 0., 0., 0.],
       [0., 0., 0., ..., 0., 0., 0.],
       [0., 0., 0., ..., 0., 0., 1.],
       ...,
       [0., 0., 0., ..., 0., 0., 0.],
       [0., 0., 0., ..., 0., 0., 0.],
       [0., 0., 0., ..., 0., 0., 1.]], dtype=float32)
Add isoform1 and isoform2 to the layer of expression data and add the name of isoform1 and the name of isoform2 to the gene name
[21]:
isoform1adata=TSSadata[:,firstdf.index.tolist()]
isoform1adata
[21]:
View of AnnData object with n_obs × n_vars = 51001 × 1784
    var: 'TSS_start', 'TSS_end', 'gene_id', 'Chromosome', 'Feature', 'Start', 'End', 'Strand', 'gene_name', 'len'
[23]:
isoform1adata.X
[23]:
ArrayView([[0., 0., 0., ..., 0., 0., 0.],
           [0., 0., 0., ..., 0., 0., 0.],
           [0., 0., 0., ..., 0., 0., 0.],
           ...,
           [0., 0., 0., ..., 0., 0., 0.],
           [0., 0., 0., ..., 0., 0., 0.],
           [0., 0., 0., ..., 0., 0., 0.]], dtype=float32)
[22]:
isoform2adata=TSSadata[:,seconddf.index.tolist()]
isoform2adata
[22]:
View of AnnData object with n_obs × n_vars = 51001 × 1784
    var: 'TSS_start', 'TSS_end', 'gene_id', 'Chromosome', 'Feature', 'Start', 'End', 'Strand', 'gene_name', 'len'
[24]:
isoform2adata.X
[24]:
ArrayView([[0., 0., 0., ..., 0., 0., 0.],
           [0., 0., 0., ..., 0., 0., 0.],
           [0., 0., 0., ..., 0., 0., 1.],
           ...,
           [0., 0., 0., ..., 0., 0., 0.],
           [0., 0., 0., ..., 0., 0., 0.],
           [0., 0., 0., ..., 0., 0., 2.]], dtype=float32)
[25]:
keepexpadata.layers['isoform1']=isoform1adata.X
keepexpadata.layers['isoform2']=isoform2adata.X
[26]:
keepexpadata.var['isoform1_name']=isoform1adata.var.index.values
keepexpadata.var['isoform2_name']=isoform2adata.var.index.values
We did not the ambiguous count value, so we set them as zero.
[27]:
keepexpadata.layers['ambiguous']=np.zeros((51001, 1784))
keepexpadata
[27]:
AnnData object with n_obs × n_vars = 51001 × 1784
    obs: 'index', 'cell_id', 'batch'
    var: 'gene_ids', 'feature_types', 'gene_name', 'isoform1_name', 'isoform2_name'
    layers: 'isoform1', 'isoform2', 'ambiguous'
In order to run BRIE2 smoothly, we set the type of data as float32
[28]:
keepexpadata.X=keepexpadata.X.astype('float32')
keepexpadata.layers['isoform1']=keepexpadata.layers['isoform1'].astype('float32')
keepexpadata.layers['isoform2']=keepexpadata.layers['isoform2'].astype('float32')
keepexpadata.layers['ambiguous']=keepexpadata.layers['ambiguous'].astype('float32')
Please make sure the expression profile of keepexpadata is raw data and the counts of isoform1 and isoform2 are also raw data
[29]:
keepexpadata.X.toarray()
[29]:
array([[0., 0., 0., ..., 0., 0., 0.],
       [0., 0., 0., ..., 0., 0., 0.],
       [0., 0., 0., ..., 0., 0., 1.],
       ...,
       [0., 0., 0., ..., 0., 0., 0.],
       [0., 0., 0., ..., 0., 0., 0.],
       [0., 0., 0., ..., 0., 0., 1.]], dtype=float32)
[30]:
keepexpadata.layers['isoform1'].toarray()
[30]:
array([[0., 0., 0., ..., 0., 0., 0.],
       [0., 0., 0., ..., 0., 0., 0.],
       [0., 0., 0., ..., 0., 0., 0.],
       ...,
       [0., 0., 0., ..., 0., 0., 0.],
       [0., 0., 0., ..., 0., 0., 0.],
       [0., 0., 0., ..., 0., 0., 0.]], dtype=float32)
[31]:
keepexpadata.layers['isoform2'].toarray()
[31]:
array([[0., 0., 0., ..., 0., 0., 0.],
       [0., 0., 0., ..., 0., 0., 0.],
       [0., 0., 0., ..., 0., 0., 1.],
       ...,
       [0., 0., 0., ..., 0., 0., 0.],
       [0., 0., 0., ..., 0., 0., 0.],
       [0., 0., 0., ..., 0., 0., 2.]], dtype=float32)
[ ]:
keepexpadata.write('/storage/yhhuang/users/ruiyan/NPC/express_to_brie.h5ad')
Get h5ad file for each cell type
Actually, here, we can get the alternative TSS usage for each cell type between NLH and NPC (two conditions).
In another words, the number that you need run BRIE2 is the same with the number of cell type.
So you need to do cell annotation for these cells and then separate them to get h5ad file for each cell types.
[33]:
annodata=sc.read('/storage/yhhuang/users/ruiyan/NPC/srafiledir/scTSS_out/NPC_new_normalized.h5ad')
annodata
[33]:
AnnData object with n_obs × n_vars = 51001 × 4226
    obs: 'cluster', 'UMAP_1', 'UMAP_2', 'patient_ID', 'condition'
    var: 'TSS_start', 'TSS_end', 'gene_id', 'Chromosome', 'Feature', 'Start', 'End', 'Strand', 'gene_name', 'len'
    uns: 'log1p'
    obsm: 'X_umap'
    layers: 'counts'
Map cell type information for each cell
[34]:
keepexpadata.obs['cluster']=annodata.obs.index.map(annodata.obs['cluster'])
keepexpadata
[34]:
AnnData object with n_obs × n_vars = 51001 × 1784
    obs: 'index', 'cell_id', 'batch', 'cluster'
    var: 'gene_ids', 'feature_types', 'gene_name', 'isoform1_name', 'isoform2_name'
    layers: 'isoform1', 'isoform2', 'ambiguous'
Note Please replace the path with your own path to store all h5ad file of cell type
[36]:
def get_celltype_adata(cellType):
    celltypeadata=keepexpadata[keepexpadata.obs['cluster']==cellType,:]
    celltype=cellType.replace(' ','_')
    file=celltype+'.h5ad'
    outputpath=os.path.join('/storage/yhhuang/users/ruiyan/NPC/diffcluster/',file)
    celltypeadata.write(outputpath)
[ ]:
for celltype in keepexpadata.obs['cluster'].unique():
    get_celltype_adata(celltype)
Get Cdr file for each cell type
The cdr file means the cell detected rate file. That is the proportion of gene in the all genes for this cell.
For different scenarios, it includes different columns.
If you want to compare two conditions, such as NLH and NPC, then you just give one column to tell BRIE2 that it is NLH or not.
If you want to campare multiple conditions, such as skin,brain and spleen, then you should give binary value for all of these organs.
[38]:
import pandas as pd
import scanpy as sc
import numpy as np
import os
[39]:
keepexpadata=sc.read('/storage/yhhuang/users/ruiyan/NPC/express_to_brie.h5ad')
keepexpadata
[39]:
AnnData object with n_obs × n_vars = 51001 × 1784
    obs: 'index', 'cell_id', 'batch'
    var: 'gene_ids', 'feature_types', 'gene_name', 'isoform1_name', 'isoform2_name'
    layers: 'ambiguous', 'isoform1', 'isoform2'
[40]:
def get_cdr_file(cellcluster):
    cellcluster=cellcluster.replace(' ','_')
    inputfile='/storage/yhhuang/users/ruiyan/NPC/diffcluster/'+str(cellcluster)+'.h5ad'
    clusteradata=sc.read(inputfile)
    diseasedf=pd.DataFrame(clusteradata.obs['condition'])
    cdrdiseasedf = pd.get_dummies(diseasedf.condition, prefix='disease')

    cdr=np.array((clusteradata.X > 0).mean(1))[:,0]
    cdrdiseasedf['detect_rate']=cdr
    cdrdiseasedf.reset_index(inplace=True)


    cdrdiseasedf.drop(labels=['disease_NLH'],axis=1,inplace=True)
    print(cdrdiseasedf)
    outfile='/storage/yhhuang/users/ruiyan/NPC/diffcluster/NPC_cdr_'+cellcluster+'.tsv'
    cdrdiseasedf.to_csv(outfile,sep='\t',index=None)
[ ]:
for celltype in adata.obs['cluster'].unique():
    get_cdr_file(celltype)
Run BRIE2
Here, we write a for loop for each cell type to run BRIE2
For more information about BRIE2, you can check this tutorial
[ ]:
#!/bin/bash

arr=(NK Myeloids Epithelial Fibroblast T_cells B_cells)
for i in ${arr[@]}
do
echao $i
brie-quant -i /storage/yhhuang/users/ruiyan/NPC/diffcluster/${i}.h5ad   -c /storage/yhhuang/users/ruiyan/NPC/diffcluster/NPC_cdr_${i}.tsv   -o /storage/yhhuang/users/ruiyan/NPC/diffcluster/Brie_out/brie_NPC_${i}.h5ad --batchSize 1000000 --minCell 10  --interceptMode gene --testBase full --LRTindex 0
done
Filter genes with TSS shift between two conditions
Here, we set the threshold as FDR<0.01 to filter genes with alternative TSS
[41]:
import pandas as pd
import scanpy as sc
[42]:
def get_sign_gene(celltype):
    celltype=celltype.replace(' ','_')
    inputfile='/storage/yhhuang/users/ruiyan/NPC/diffcluster/Brie_out/brie_NPC_'+celltype+'.brie_ident.tsv'
    briedf=pd.read_csv(inputfile,delimiter='\t')
    print(briedf)
    signTdf=briedf[briedf['disease_NPC_FDR']<0.01]
    outputfile='/storage/yhhuang/users/ruiyan/NPC/diffcluster/sign_Gene/'+celltype+'.csv'
    signTdf.to_csv(outputfile,index=None)
[ ]:
for celltype in keepexpadata.obs['cluster'].unique():
    get_sign_gene(celltype)
Display gene with alternative TSS using valcano plot
For this part, you can also refer to BRIE2 example.
[43]:
import brie
import scanpy as sc
import matplotlib.pyplot as plt
[44]:
print(brie.__version__)
2.2.0
[45]:
adata=sc.read('/storage/yhhuang/users/ruiyan/NPC/diffcluster/Brie_out/brie_NPC_T_cells.h5ad')
adata
[45]:
AnnData object with n_obs × n_vars = 24571 × 1628
    obs: 'cluster', 'UMAP_1', 'UMAP_2', 'patient_ID', 'condition'
    var: 'gene_ids', 'feature_types', 'gene_name', 'isoform1_name', 'isoform2_name', 'n_counts', 'n_counts_uniq', 'loss_gene'
    uns: 'Xc_ids', 'brie_losses', 'brie_param', 'brie_version'
    obsm: 'Xc'
    varm: 'ELBO_gain', 'cell_coeff', 'fdr', 'intercept', 'pval', 'sigma'
    layers: 'Psi', 'Psi_95CI', 'Z_std', 'ambiguous', 'isoform1', 'isoform2'
[46]:
adata.uns['brie_param']
[46]:
{'LRT_index': array([0]),
 'base_mode': 'full',
 'intercept_mode': 'gene',
 'layer_keys': array(['isoform1', 'isoform2', 'ambiguous'], dtype=object),
 'pseudo_count': 0.01}
[47]:
#Change gene index from Ensemebl id to gene name

adata.var.index=adata.var['gene_name']
adata.var.index
[47]:
Index(['C1orf112', 'FGR', 'NFYA', 'STPG1', 'KRIT1', 'SNX11', 'CASP10', 'CFLAR',
       'SARM1', 'FKBP4',
       ...
       'UHRF1', 'CCL4L2', 'MYO19', 'GGNBP2', 'ACACA', 'TMEM191B', 'NKILA',
       'AC073111.5', 'ARHGAP11B', 'AC016831.7'],
      dtype='object', name='gene_name', length=1628)
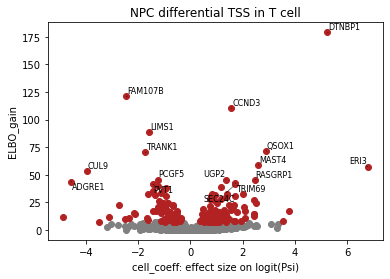
[49]:
## volcano plot for differential splicing events
#fig = plt.figure(figsize=(4.5, 3.5), dpi=300)
brie.pl.volcano(adata, y='ELBO_gain', log_y=False, n_anno=16, score_red=7, adjust=True)
plt.xlabel('cell_coeff: effect size on logit(Psi)')
plt.title("NPC differential TSS in T cell")
#fig.savefig('/storage/yhhuang/users/ruiyan/figure/figure5/T_volcano.pdf',bbox_inches='tight',dpi=300)
plt.show()
[ ]: